


Dashboards
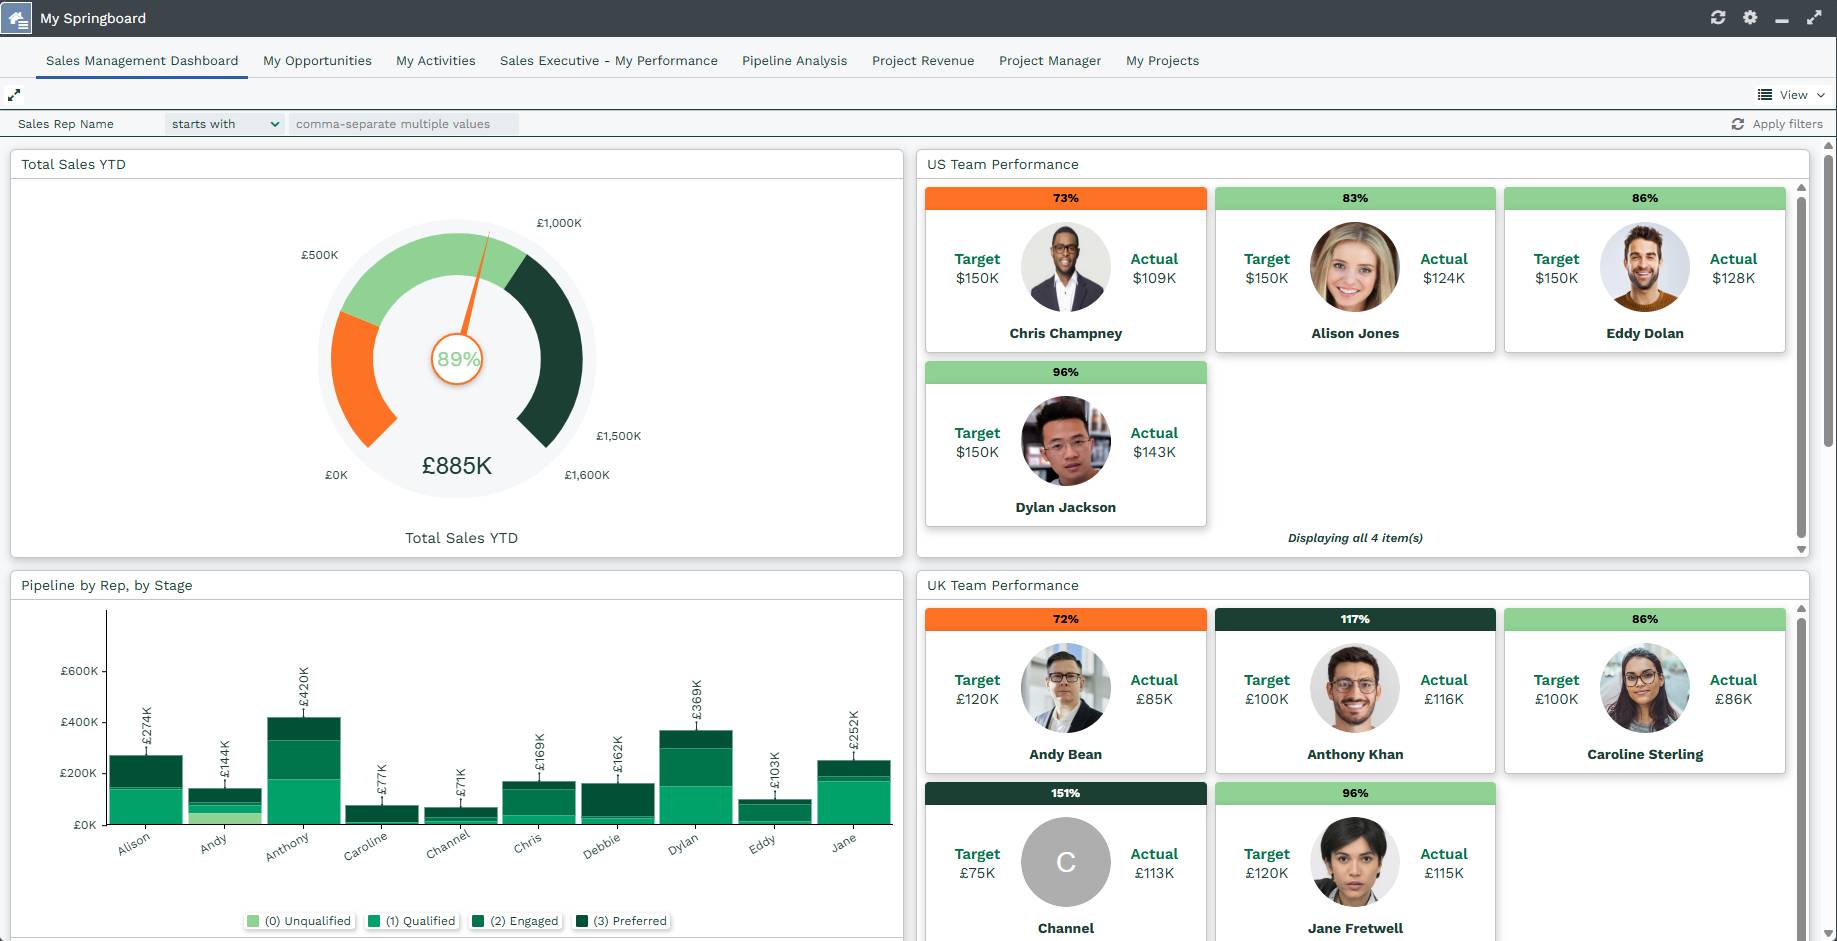
Dashboards offer you a real-time, holistic view of your business; they can show you selected Reports, Charts or other elements in an easy to read and understandable format.
Dashboards provide a streamlined view of key business areas, making it easy to monitor performance and trends at a glance. Common use cases include managing sales pipelines, overseeing case resolution, and tracking your company’s financial health
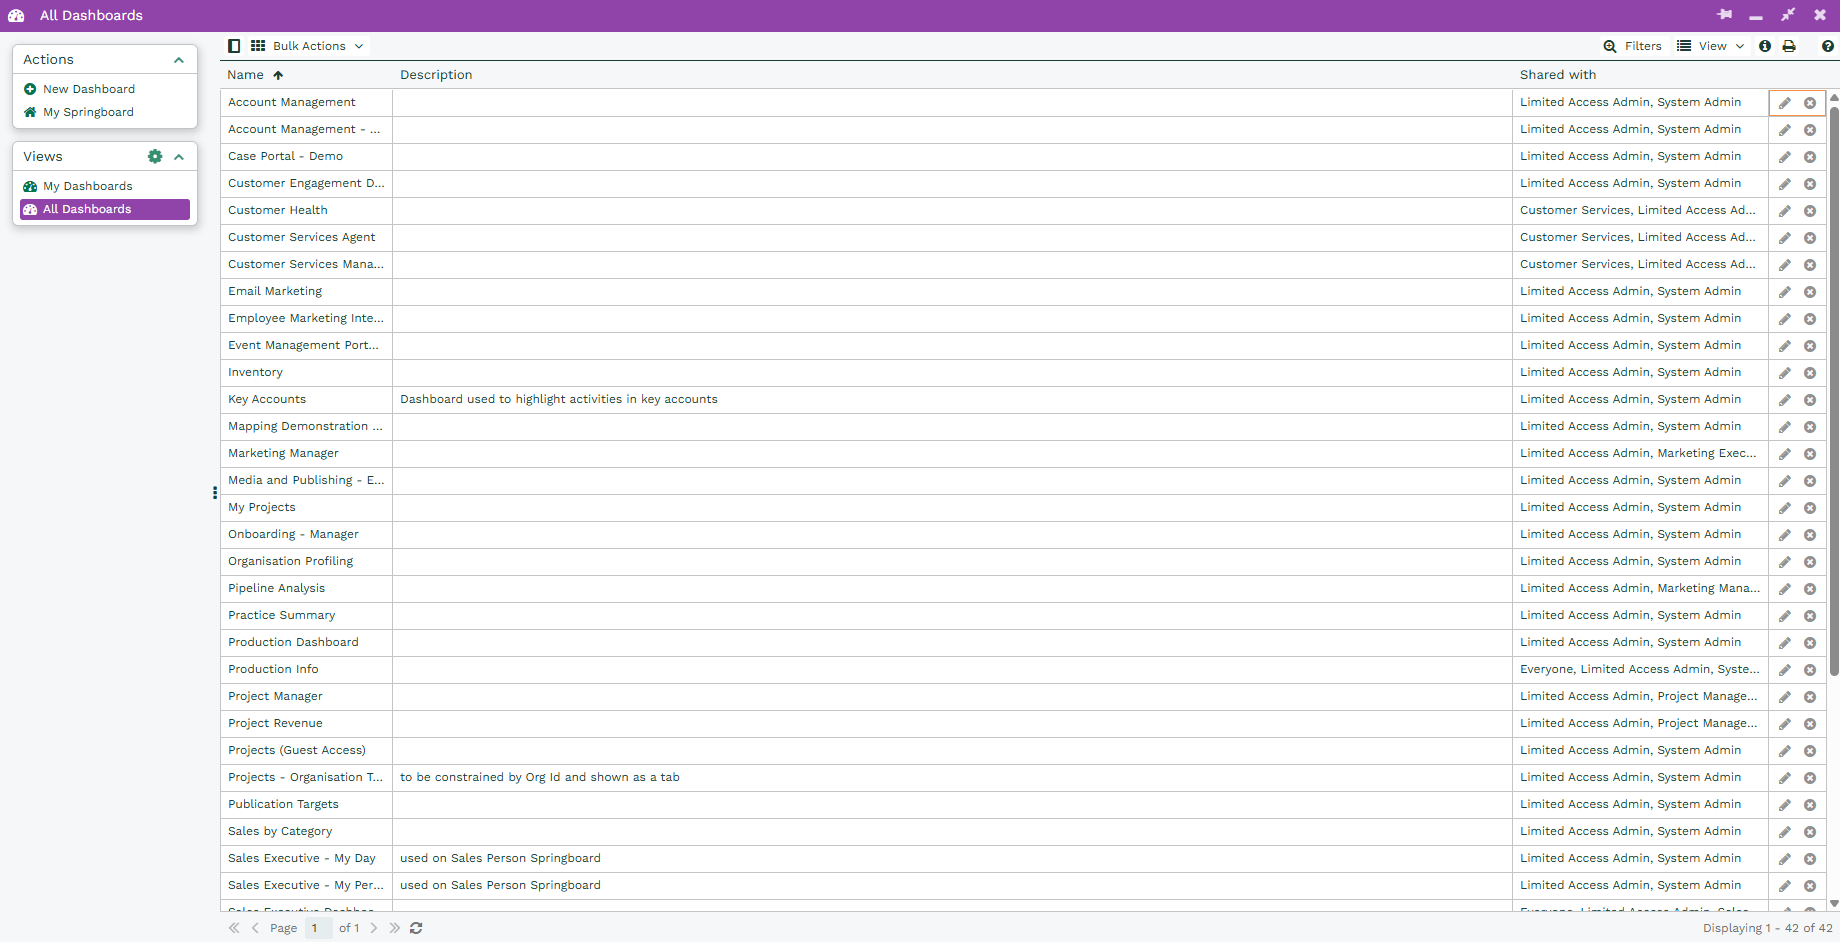
You can create or edit dashboards directly from the Dashboard Menu, accessible by navigating to the Dashboard Landing Page, Start > Dashboards, or from the Start Menu, Start > New > Dashboard.
Using Start > New > Dashboard opens a new window which allows you to add a Name, Description, Category, type of Records that can be created from this Dashboard and decide the Column layout of the Dashboard. The Colum layout controls the number of Columns in the Dashboard as well as the ratio of space each column uses. These can be changed at a later date if you decide you want to rename your Dashboard or change the layout of the Columns.
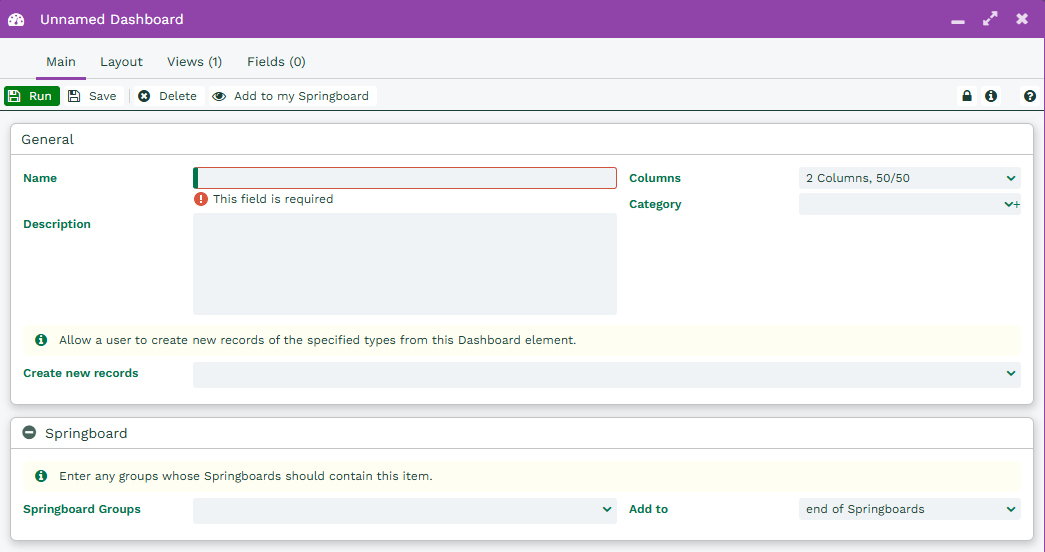
In the Springboard section, Springboard Groups allows you to bulk add the new Dashboard for all Users within the User group(s) selected and Add to field is used control its placement on user’s Springboard.
Once you have set this up, you can start adding elements to the Dashboard. These are added from the Layout Tab, click the Add button.
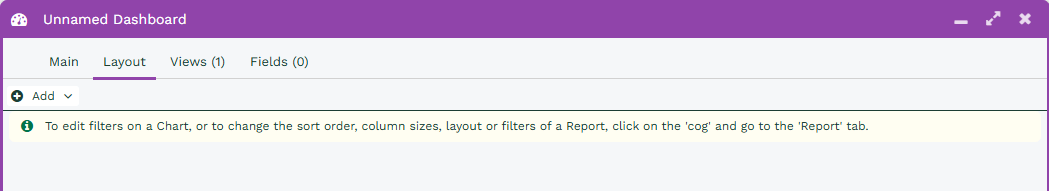
There are five different types of elements that can be added to a Dashboard:
- Charts: Charts provide a pictographic output of a specific Report View, these can be further filtered or amended as required once added to the dashboard.
- Reports: Report Views can be added to the Dashboard so that results from a number of different reports can be easily referred to in one place.
- Landing page views: Landing page views give you quick, lightweight insights into your data.
- Web Pages: Specific Web Pages that may provide regular updates, such as an overview of the service status can be added to the Dashboard.
- Web Processes: A Web Process, such as a Case or Lead allocation Script, can be called directly from the Dashboard.
Remember: Reports added to a Dashboard are visible to the Users with whom the Dashboard has been shared even if the User hasn’t been given explicit permission to access the Report. However, if the underlying Report hasn’t been shared with the User, they won’t be able to drill into the detail from the Dashboard.
Click here for more information on Adding Dashboard Elements.
Dashboard menus are hidden by default. However, you can select this button to view:
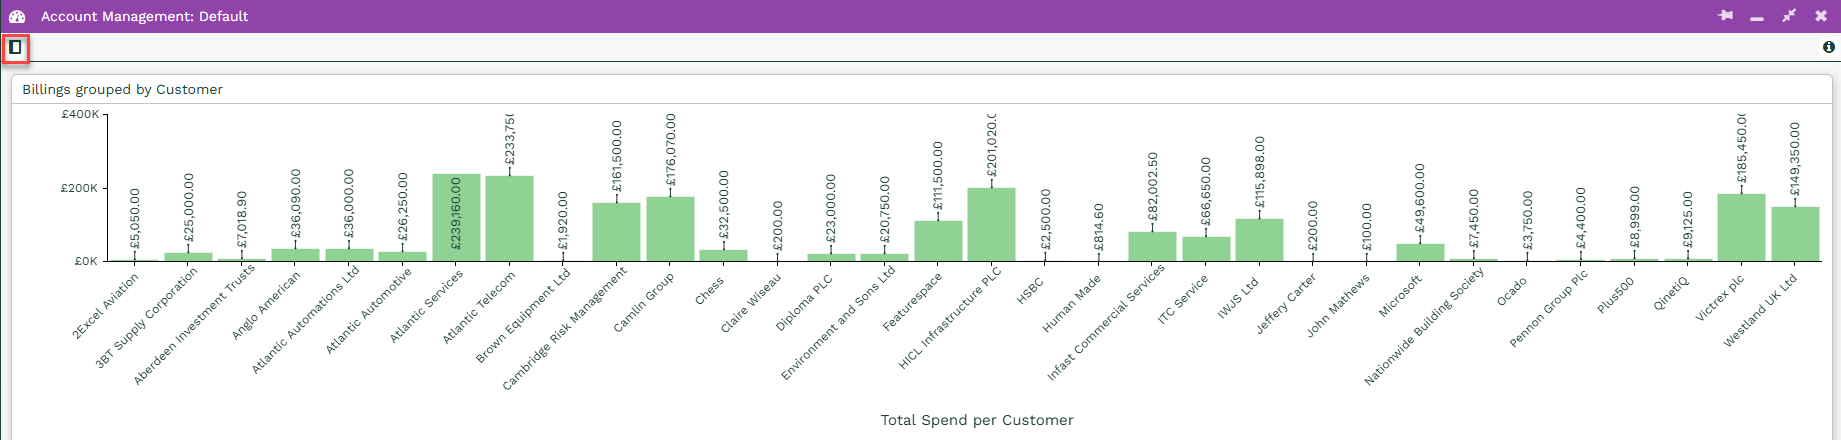
Alternatively, it can be viewed from the icon menu:
Views
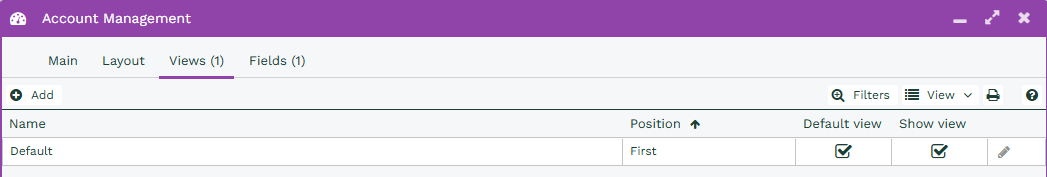
When you create a Dashboard, a default View is automatically generated. This View is where you can configure specific Filters and Field mappings. By setting up multiple Views within the same Dashboard, you can tailor the experience for different User Groups, such as creating distinct Views for various teams without needing to build separate Dashboards for each of them.
More information on the configuration of Views can be found on our Adding Views to Dashboards Knowledge Base page.
Fields
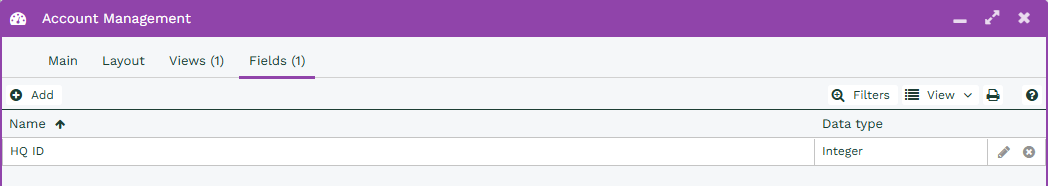
The Fields tab allows you to set up Filters over a number of different Dashboard windows, these can be applied to any of the Views setup on the Dashboard as needed.
We have more information and examples of Field Mappings and filters on our Knowledge Base page, Dashboard Fields.