


Dashboard Views
You can create multiple views within a dashboard, each with different filters applied, to present data in various formats tailored to specific needs
To add a View to a Report, go to Start > Dashboards select a Dashboard to open and open your Dashboard menu. You will then see the option to Edit this Dashboard.
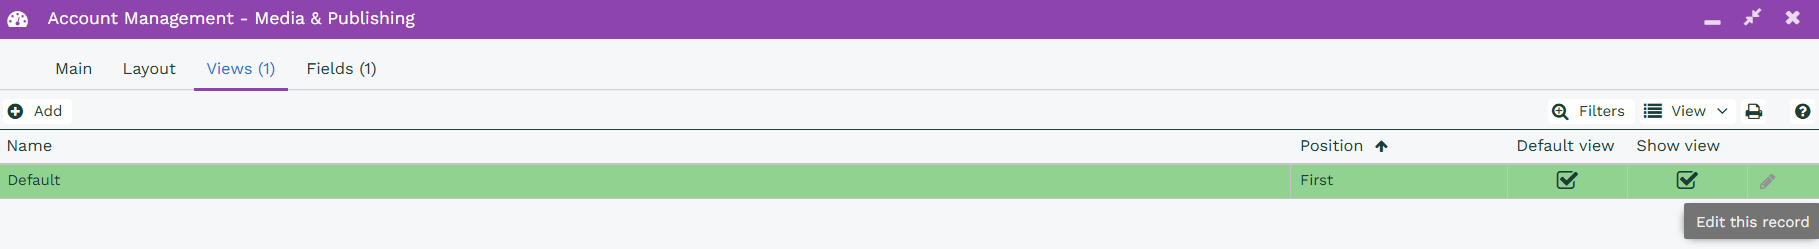
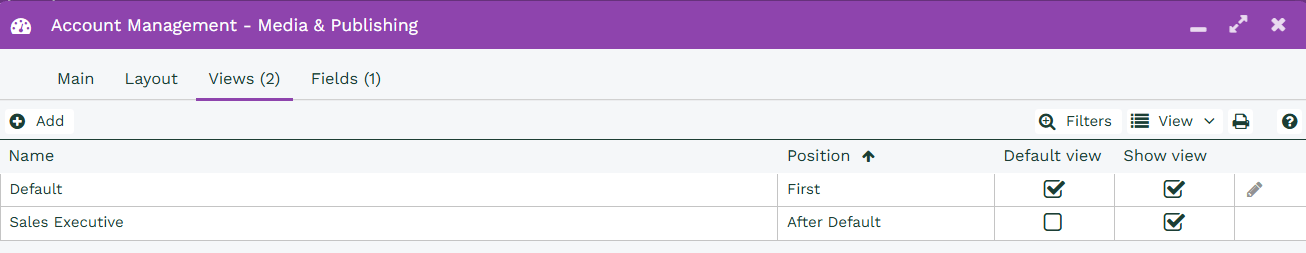
Once you are in edit mode, navigate to the Views Tab (there will always be at least one View called Default). This View can be edited if needed by using the Pencil Icon. From this Tab you can see which Views are available for Users as well as which View is set to the Default view.
Note
When a View is set to be the default View it cannot be deleted from the Dashboard, only amended.
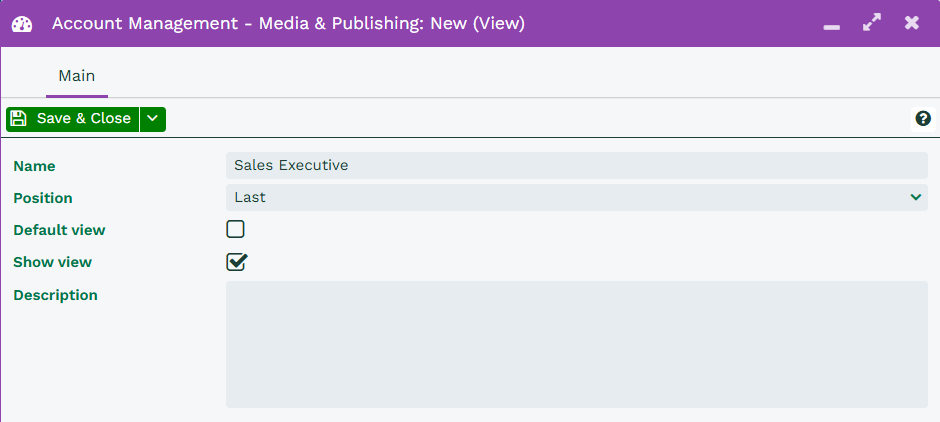
To create a new View, click the Add button. This will create a new dialogue box that allows you to name and position your newly created view. Once you have named the View you can decide whether you want this to be set as the Default View for Users as well as whether it is shown or not. Additionally, a Description can be added to provide a short summary of what the View contains.
Note
View names need to be unique across all Dashboards
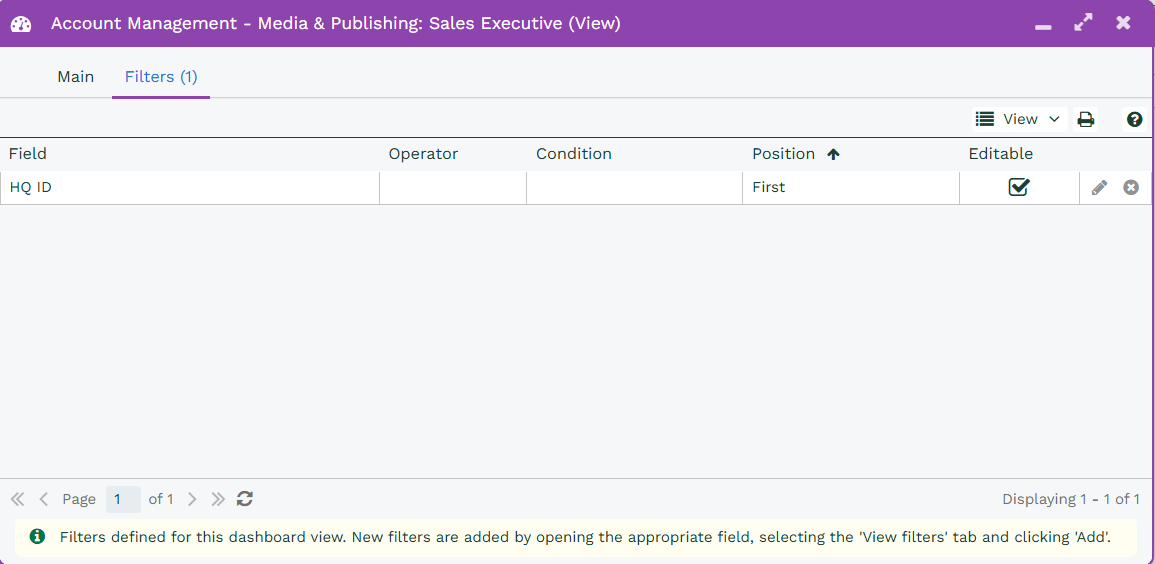
Filters can be added to a specific View, and once the View has been saved the Filters tab will appear. Filters are view specific to each View and can be added from the Fields tab on the Dashboard
Once you have have set up your View you can run the Dashboard. The View will now appear under the Views section like it would with a Landing Page.
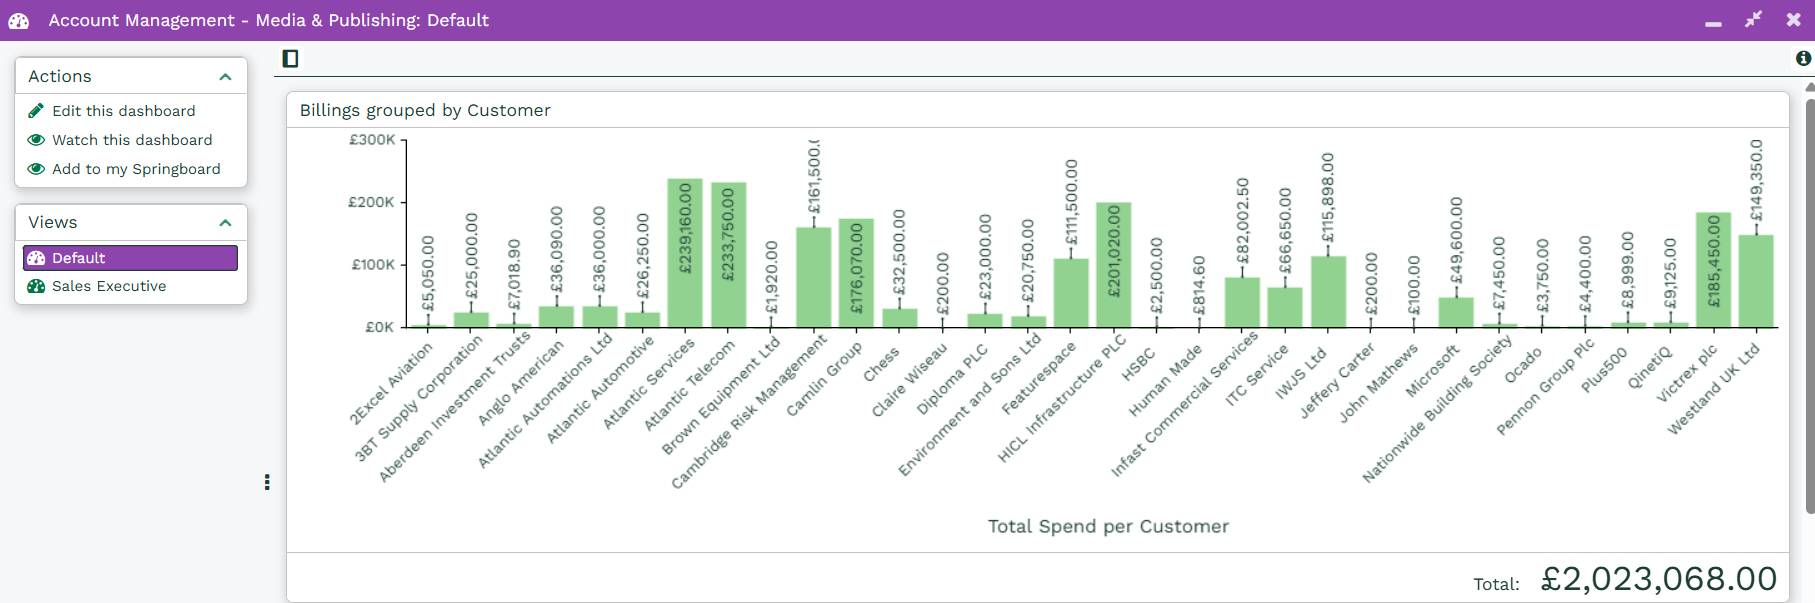
If the Default view checkbox is checked on the View then when the Dashboard is ran this will be the View that will be the one loaded when the Report is run.
The Default View will also include any filters applied to the View for Users to see.